from meaningful data
Energy Analytics
Let us help you to reduce your carbon, cost and consumption with the Energy Manager overview. Interactive sliders, instant alerts and cost-focused calculators will enable you to eliminate waste, optimise your load and find profitable investments within your energy estate.
Key Features
- A digital energy manager which provides useful actionable insights
- GHG and CRC reporting by both billed and actual consumption (CO2e, CO2, CH4, N2O)
- Budget variance tracking
- Advanced value-led data visualisations filterable by portfolio, group and at site level
- Renewable assets performance monitoring and modelling
- Weather and consumption/cost regression analysis
- An extensive suite (50+) of downloadable reports including consumption, vacant energy and energy intensity
- Dashboards for site level performance indicators and league tabling
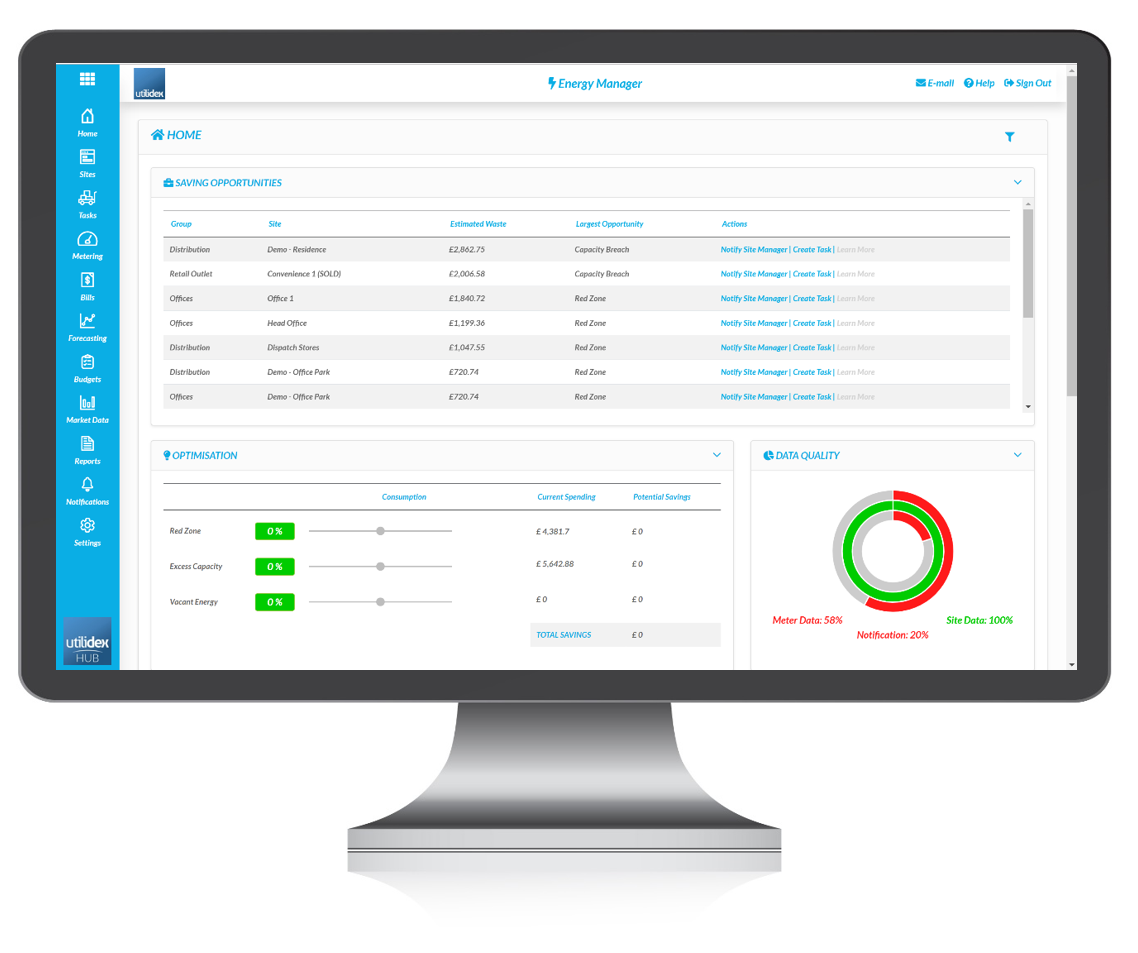
Bringing your key data together into one ‘Energy Manager’ dashboard means it’s easy to track common issues, such as vacant energy and red zones, and to quickly see opportunities for actionable savings or optimisation. By setting up notifications you’ll also receive instant alerts, so you never miss an opportunity.
Data is displayed in kWh versus cost, you can understand your pence per unit (PPU) cost on a site or portfolio level, compare year vs year or site vs site results and track budget variances. The system is all the time checking data quality and displaying a data quality score so you know that you can trust the information whether you’re monitoring energy intensity or identifying which sites to target for capital projects.
Value led data analytics using the intuitive in-app dashboards.
We’ve integrated some powerful dashboards which help you identify opportunity within your portfolio and perform a deep analysis of the data. These range from quick identification of out of hours energy usage, to analysis of consumption & cost over the different seasons, through to integrating weather data to help make and justify budgetary adjustments.
Maybe it’s help with carbon compliance you want?
Consumption and GHG reporting at the click of a button will show you how you are fulfilling your responsibilities. Reports can be generated either by direct metered consumption, or a bend of billed and metered consumption. Tracking Carbon targets is also simple and can be set at a site level and tracked against through the month.
Adding renewable assets to the system is no problem.
The dashboard displays the import by kWh or daily generation and allows you to compare generations as a percentage of consumption and see what costs/carbon have been saved.
Organising your portfolio to reflect how your sites are grouped.
You can organise your portfolio in a way that best suits you and your business. With multiple groups and hierarchies and the ability to add additional custom codes and detailed reports such as consumption, spend, savings and renewable, the data will show in exactly the way you need to see it.
FIND OUT HOW WE CAN HELP
Applications to help you do more
You can purchase any one of our software products direct as a customer, or through our partner consultancy firms (TPIs), or via energy suppliers. Our goal is to make it easy for you to work together, and stay in control of your energy estate.

Utility Bill Validation

Budgeting & Demand Forecasting
Accounting Intergration

Wall boards & Dashboards

Trading & Energy Procurement
Latest Insights.

The Revolution in Energy Billing: Embracing Market-wide Half-Hourly Settlement with Utilidex
In an era where sustainability is paramount, the transition to Net Zero is no longer an aspiration but a necessity by 2050. Supporting this transition in the UK's energy sector is the implementation of the Market-wide Half-Hourly Settlement (MHHS). The MHHS initiative...
Introducing Procode and Utilidex: Uniting for Agile Cloud Innovation and Data Excellence
We’re thrilled to announce a landmark partnership between Procode and Utilidex, two pioneers in the energy SaaS industry. Together, we’re setting new standards in agile development, cloud technology adoption, and data management excellence.

Streamlining Energy Billing and Reconciliation: Utilidex’s Comprehensive Solution
In today's rapidly evolving energy landscape, the transition towards clean and sustainable energy is at the forefront of global efforts. Energy suppliers are increasingly adopting Power Purchase Agreements (PPAs) to support this shift. However, managing the complex...
