

After a period of relative stability, with the majority of the industrial and commercial sector beating their energy budget year on year, it looks like accurate budget management will return as perhaps the number one priority in 2017 for those involved in energy procurement and management.
We know one of our customers’ key priorities in managing their energy estates is to accurately set, and track their energy budget each year. In order to provide transparency, budgets need to be monitored both at the portfolio level and on a site by site level; where sites that are under/over budget are easily identified and we can glean a reason why this has happened from the data.
Oil prices are ticking up, electricity and gas prices to the mass market are increasing and it is only a matter of time before energy suppliers begin to transfer high volatile spot prices back into the bill. Third Party costs are on the rise in 2017 and 2018 and energy management teams need to be making provision for these. So, automated and consistent budget tracking and, in particular, understanding the key drivers that are causing sites to run over budget are going to be essential in order to report accurately to the CFO or Board Executives.
Whilst Utilidex had a large number of the core components in the system to support budgeting what we have not done until now is brought this data together so that in just three clicks you can see if a site or group of sites is over budget and whether this down to an increase in cost or consumption, or both! Due for General Release in March 2017, the new Energy Budget will be available for all Standard & Enterprise Utilidex Hub users and here is a sneak peak of what to expect.
Click 1 – Tracking the budget
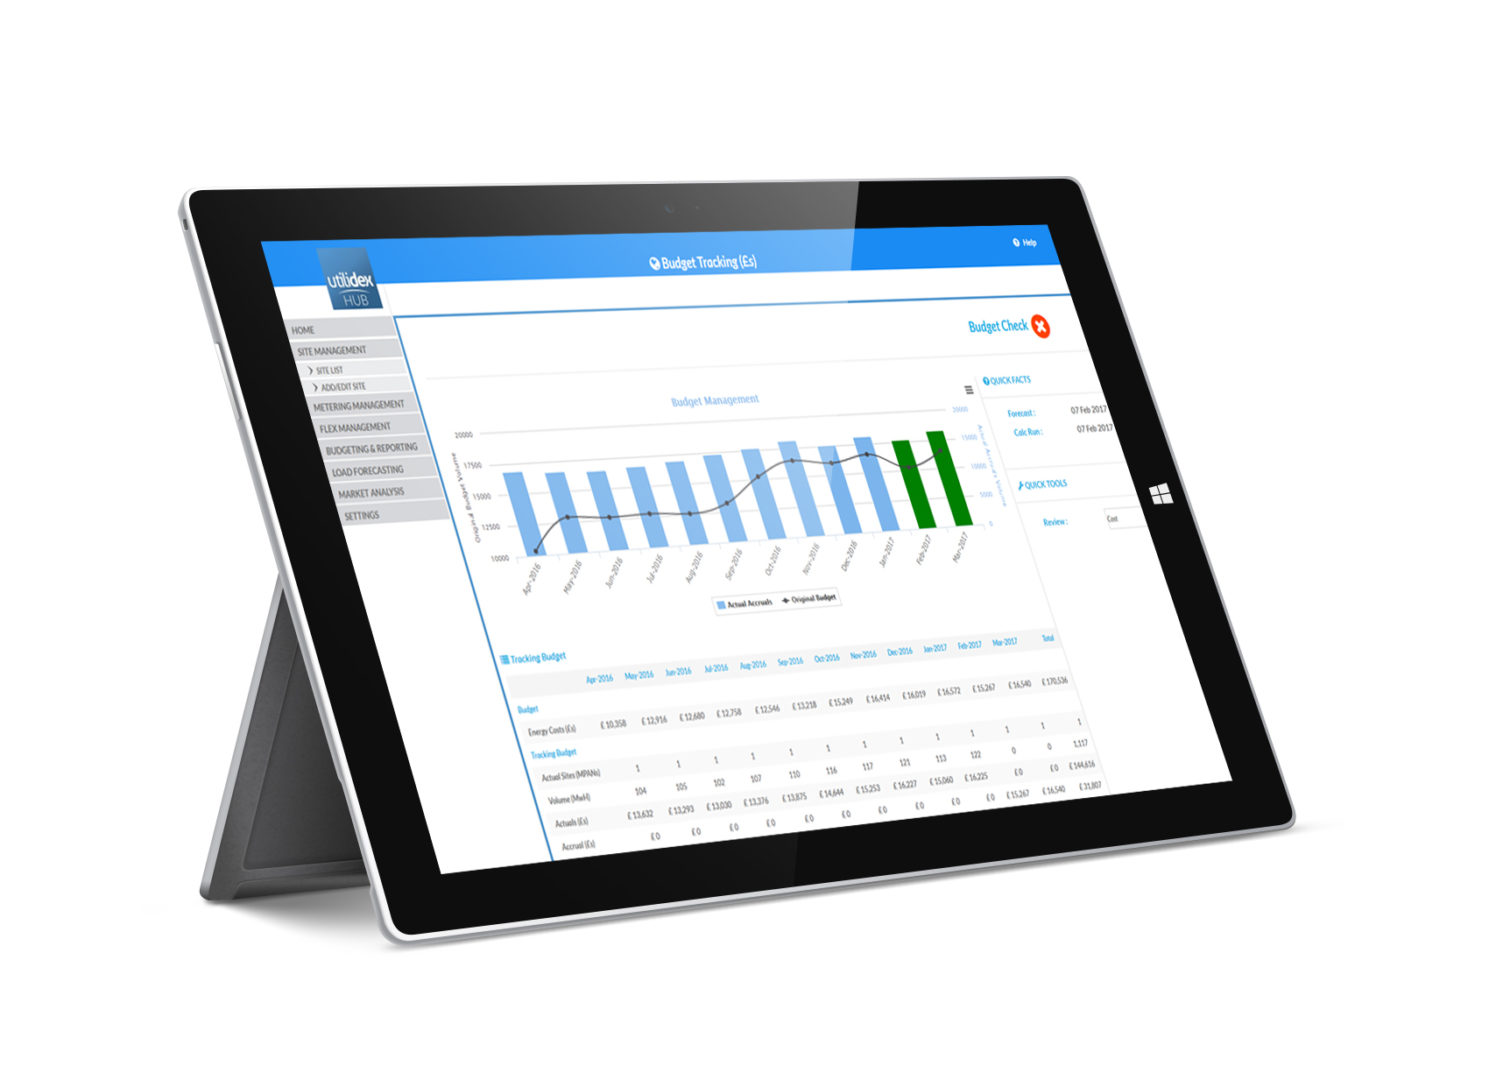
The Tracking Budget Screen is your key screen to view how you are tracking against budget. As new bills arrive, or as meter data is updated, the Utilidex system will track the Actuals and then perform a comparison to show you how much you are under/over budget.
The tracking tool comes with a set of handy indicators, letting you know about volume, cost and £/MWh variances, so you can easily see where any differences have come through. And, you get a really quick and easy tick (or cross) letting you know if the budget is on track.
At the bottom of each month, there is a count of the sites which are over/under budget for that period, and by clicking on the link you’ll be taken to the list of sites.
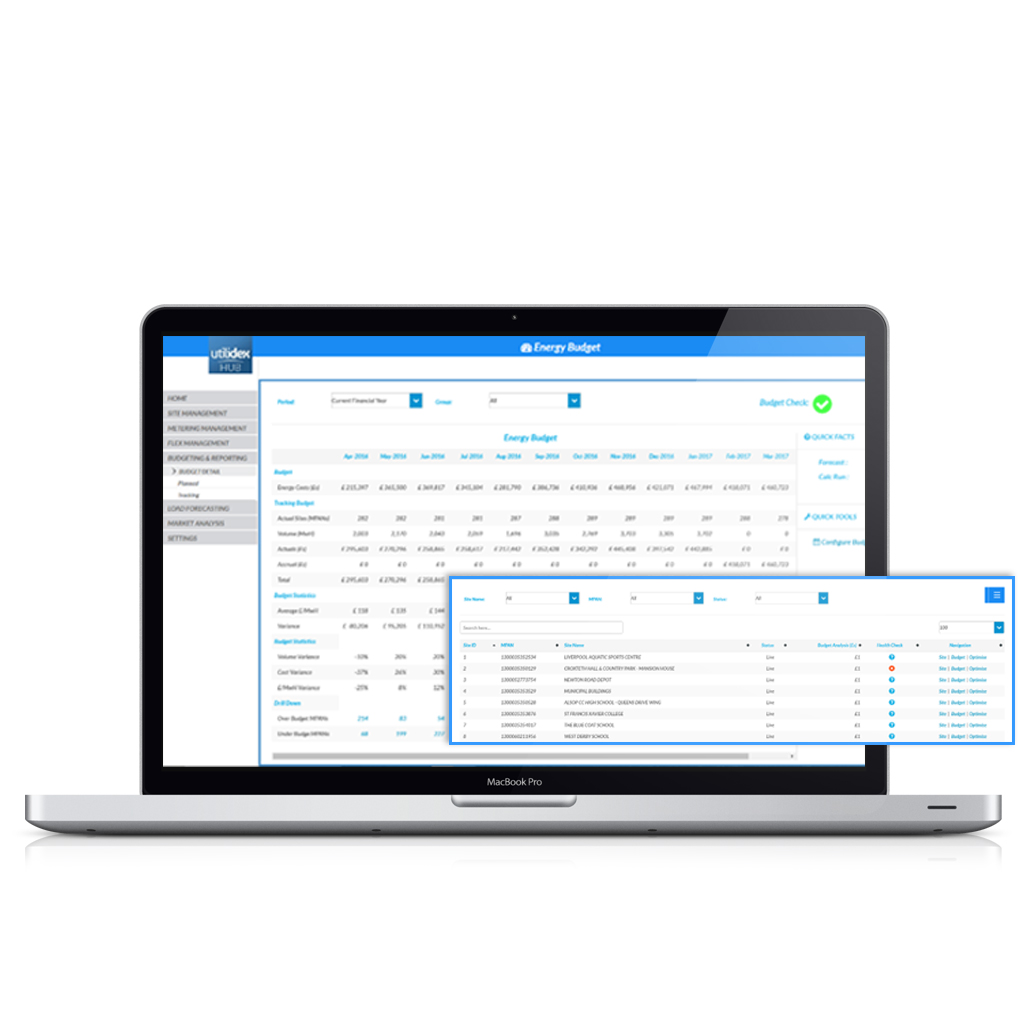
Click 2 – Reviewing your sites
Easily sort your sites by budget variance, then click on Budget Navigation to track through to the sites’ individual screen. From here you can easily see if it’s a one off month, or the site has been tracking off budget for a while.
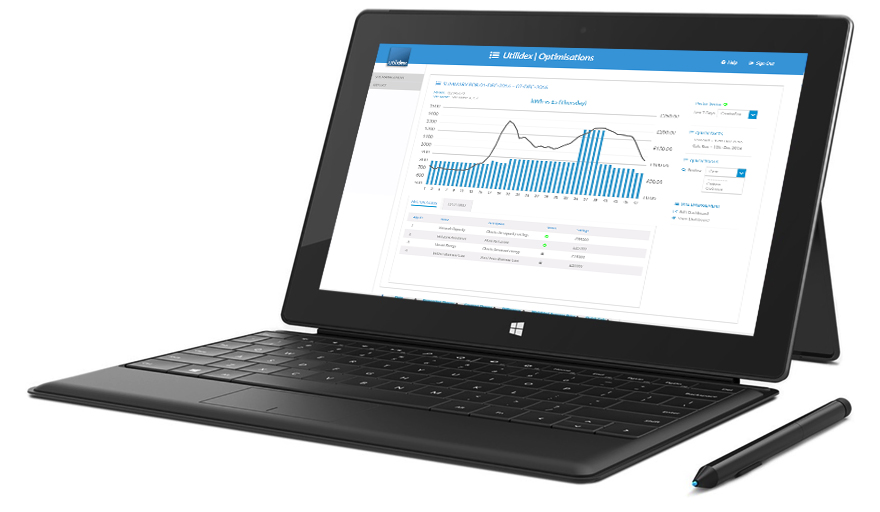
Click 3 – Find extra savings
Simply select “Optimise” from the Site Budget Screen, or from the Site List screen and you’ll be taken to your own Digital Assistant, Hector’s optimisation page. It’s our goal in 2017 to speak to as many customers as we can, to find out all the tips and tricks on managing your energy costs, then turn them into clever algorithms that continually monitor the estate for any issues.
A big thanks to all of our supporters and customers that continue to drive our products forward. We’re working harder week by week to make sure our products are the best in the market, and we fulfil our goal of simplifying your complex energy world!
Be the first to find out more! Get in touch with Richard Lewin today and make sure you are not missing out on important opportunities. [email protected] or call on 07734906592.
